

More than 204 million motor vehicles make daily crossings over approximately 60,000 bridges in the United States that are classified as structurally deficient. The federal government over the last decade has pumped between $6 billion and $7 billion per year into bridge projects. Now, a U.S. Government Accountability Office (GAO) report is recommending that the Federal Highway Administration (FHWA) develop a system to measure the outcomes of that funding.
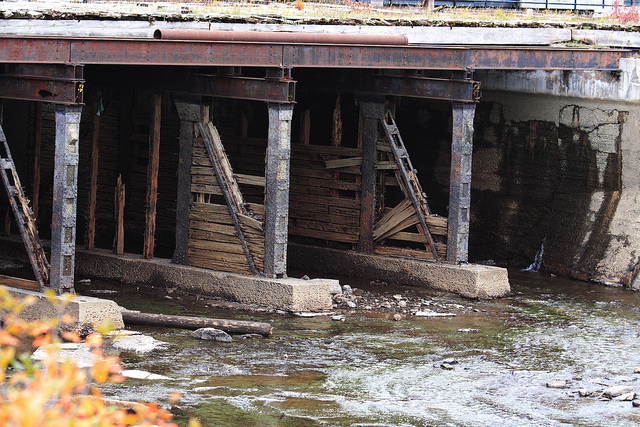
Photo by Michelle Tribe is licensed under CC BY 2.0
Structurally deficient bridges are not necessarily bridges deemed unsafe. Rather, they are bridges that show some significant defect in their condition. And although the GAO report indicates that the percentage of structurally deficient bridge area that carries vehicles has decreased from 9 percent to 7 percent from 2006 to 2015 and the number of structurally deficient bridges decreased from 13 to 10 percent during that time, those numbers are likely to increase soon.
The GAO report notes that the number of bridges in the U.S. increased dramatically from the 1950s to 1970s and now those bridges, which were designed with a design life of 50 years, are approaching that 50-year mark. As a result, they are requiring additional maintenance, preventive maintenance, rehabilitation or, in some cases, replacement. During the last 10 years, many states report that a significant portion of their federal bridge funding is now dedicated to preserving existing bridges rather than building new ones.
The GAO recommendation to track performance outcomes of federal dollars spent on bridges could determine if changes in how those dollars are allocated and used could result in better outcomes. It could also lead to consideration by states of the use of additional private-sector capital as part of the funding equation.
GAO surveyed transportation officials in 24 states (most chosen because of their large bridge inventories) and the District of Columbia for its report. Nearly half of the states surveyed listed their major challenges in keeping up with bridge needs as lack of available funding and an increase in the number of aging bridges needing attention.
To shed some light on the condition of bridges in the states, information from the 2015 National Bridge Inventory Date released by the FHWA in January ranks Rhode Island as the state with the most structurally deficient bridges. Of the 766 bridges in the state, 23 percent – or 178 – are classified as structurally deficient. The structurally deficient ranking means that one or more key bridge elements such as deck (driving surface), superstructure of substructure are labeled as in “poor” condition or worse. From 2005 to 2014, the federal government injected more than $930 million for capital improvement projects in on 325 bridge projects in the state.
Ranked number two in structurally deficient bridges is Pennsylvania, where 4,783 (21 percent) of bridges are structurally deficient. Iowa ranked as the state with the third-most structurally deficient bridges at 5,025, or 21 percent.
On the other end of the spectrum, Texas reported the lowest number of structurally deficient bridges in its more than 53,000 bridge inventory. Slightly more than 1,000 of the state’s bridges, or 2 percent, were classified as structurally deficient. More than 4,600 of the bridge projects in the state benefitted from a federal investment of $8 billion in funding from 2004 to 2015.
Bridge funding challenges are expected to continue nationwide. Experts say hundreds of billions of dollars are needed for the repair and upgrade of the states’ bridges. If the FHWA develops measures to link bridge funding to outcomes that result in better performance and efficiency, those findings could impact how Congress allocates federal funding for bridge programs in the future. However, the problem of limited available resources will continue, and collaborative efforts with the private sector can provide state officials with additional options.